I was working on a day-long presentation on addressing challenging behaviors for a good bit this week and I wanted to share this little trick that sometimes gets lost in our high tech world. When I talk about addressing challenging behaviors, it’s essential to talk about functional behavior assessments. If we don’t know what the function of the behavior is, we don’t know what to do about it. So, one of the stumbling blocks I frequently encounter with teams doing FBAs is taking and summarizing the data. They might take the data but then just try to eyeball it to see if there are patterns. They aren’t sure how to summarize it, they don’t know how to graph it, etc. If you’ve ever had this problem, then this quick and dirty trick might be for you.
First, let me say that I am planning to do a series of posts on behavioral problem solving that will encompass more extensive information about the functional behavior assessment process and how to take that information and use it to develop behavioral support plans for students. Today I just wanted to share this quick tip that might make the process a bit more efficient.
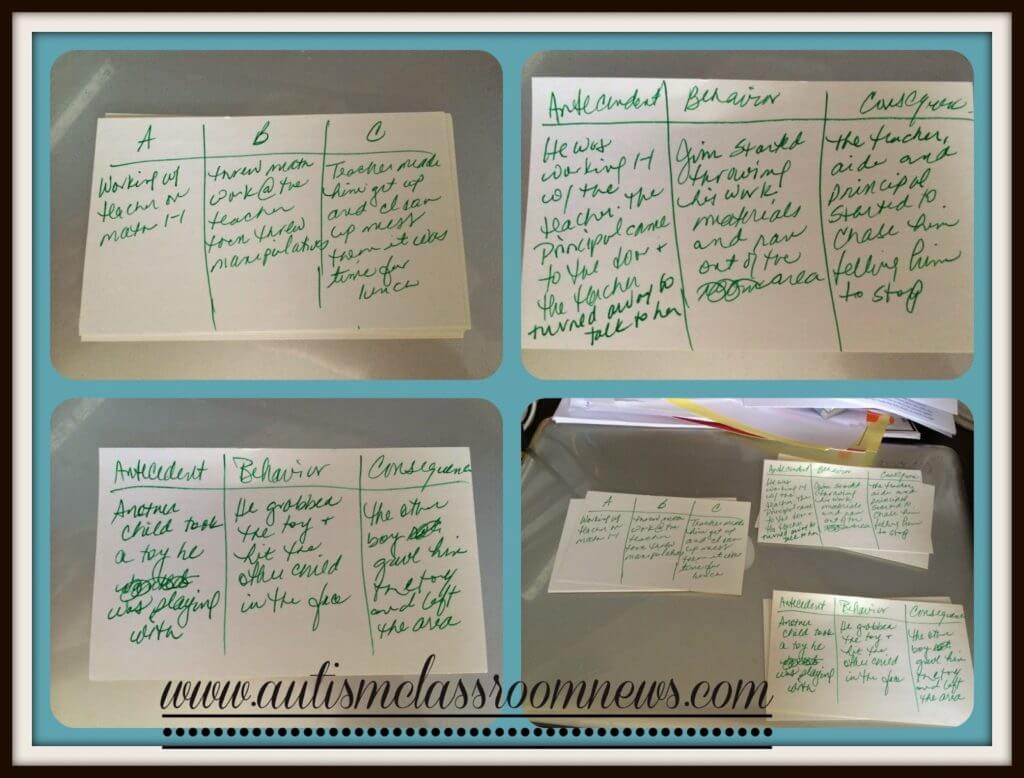
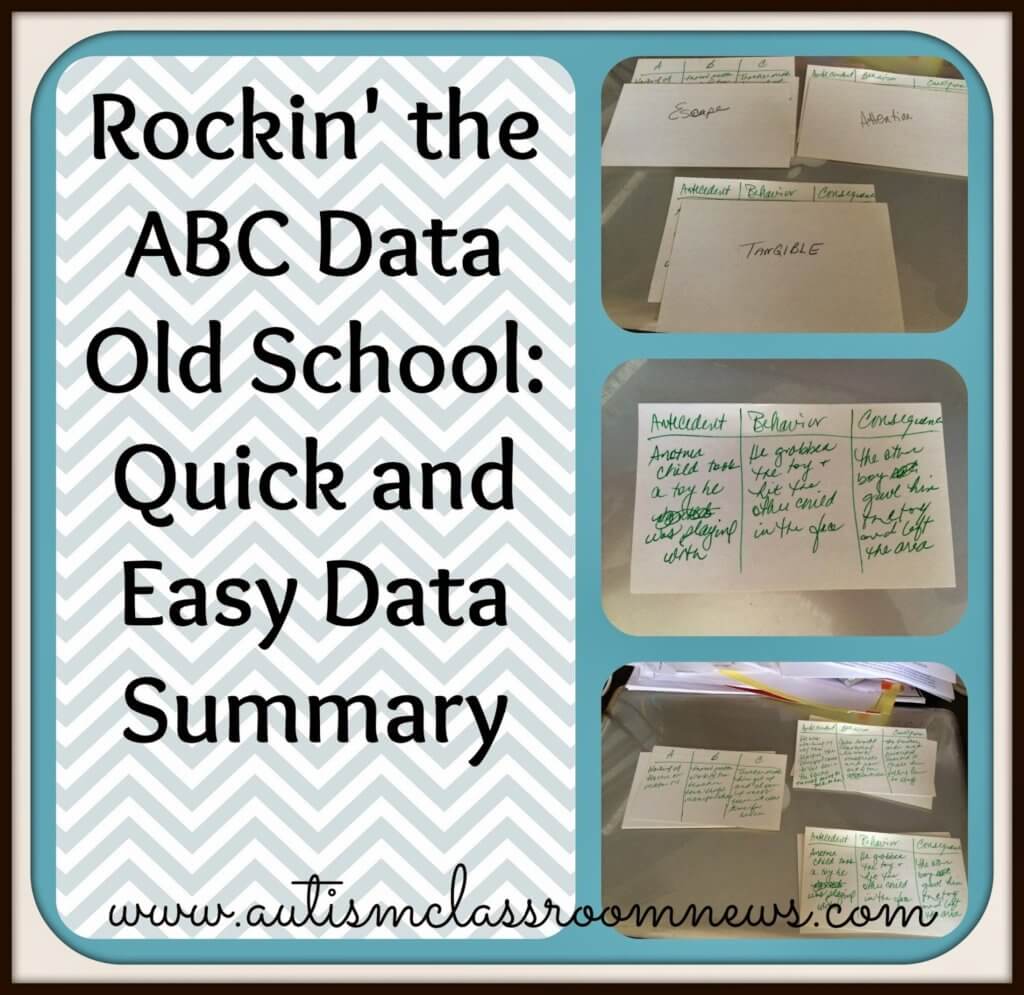
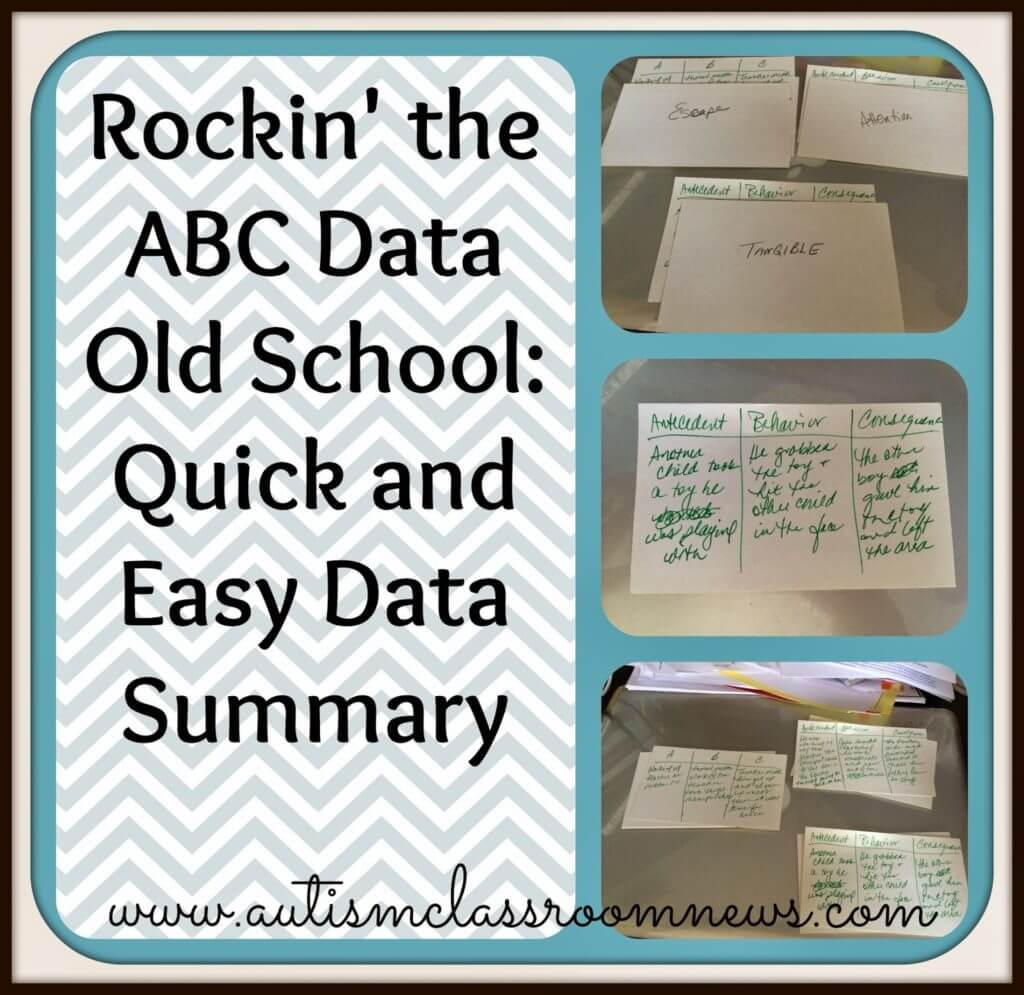
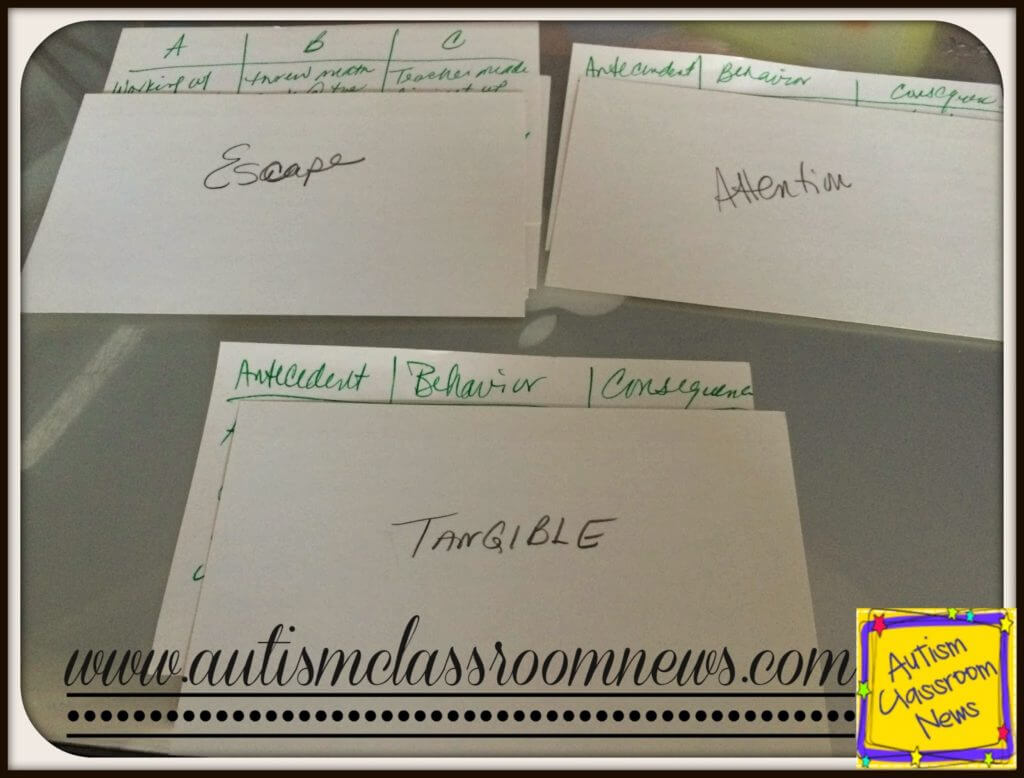
So, it’s pretty straightforward. Index cards. This is an easy and portable way to take data. You can see above that I just divided the cards into thirds–antecedent (what is going on in the environment before the behavior happens), behavior (the target behavior and what it looked like), and the consequence (what happened after or as the behavior happened). There are quicker ways to take data than writing it all out that I will talk about in future posts. However, here are the advantages I see to using index cards.
- You can tuck them in your pocket with a pen and have your data collection tool wherever you go. It’s not high tech, but it’s easy to carry and easy to record the behaviors when you see them.
- By filling it out, instead of using a checklist, you get richer information if everyone taking data is trained to take it.
- The biggest advantage I see comes in the summary system. Instead of graphing, simply stack the cards according to how you want to sort them. Because each behavior is recorded on a single card, you can just sort them and count them to summarize the data easily. So, if you want to see if there are patterns in the antecedents, sort them by common antecedents (e.g., working 1-1, in a group setting, teacher talking to adult). If you want to see if there are common consequences, stack them according to that (e.g., teacher reprimand, other kids laughed). And finally, one of the easiest for me is to take each index card and hypothesize a function and write the hypothesized function on the back (e.g., gaining attention, escaping from social situations, gaining a desired toy from peers). Then I sort them as you see below to develop what I think will be the primary and secondary hypotheses about the behavior. The highest stack of cards is the primary function and probably the one I want to address first. And that’s it! Easy peasy!
So, what systems do you use to take FBA data in your class?
Until next time,